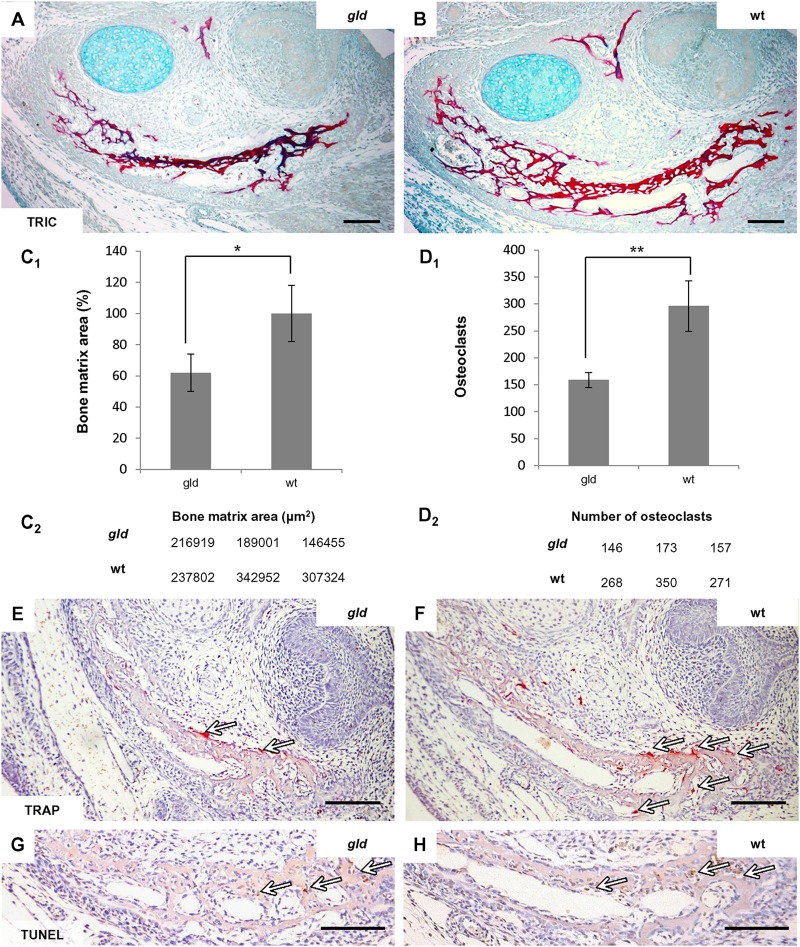
FIGURE 5.
Analysis of prenatal (E15) jaw bone of gld mice. The mandibular bone visualized by trichrome staining in gld mouse (A) and wild-type mice (B), decrease of bone matrix in gld mice (n = 3 animals) compared to wild-type animals (n = 3 animals), avggld = 184.125 μm2, sdgld = 35.484, avgwt = 296.026 μm2, sdwt = 53.478, p = 0.0392 (C1,C2), decrease of osteoclasts detected by TRAP-staining in gld mice (n = 3 animals) compared to wild-type mice (n = 3 animals), avggld = 159, sdgld = 14, avgwt = 296, sdwt = 47, p = 0.0079 (D1,D2), TRAP-staining in gld (E) and wild-type mice (F) detection of apoptotic cells (TUNEL) in the mandibular bone of gld (G) and wild-type mice (H). Arrows point to the positive cells (immunohistochemistry-brown, TRAP-purple). Scale bar = 100 μm. ∗p ≤ 0.05 and ∗∗p ≤ 0.01.

