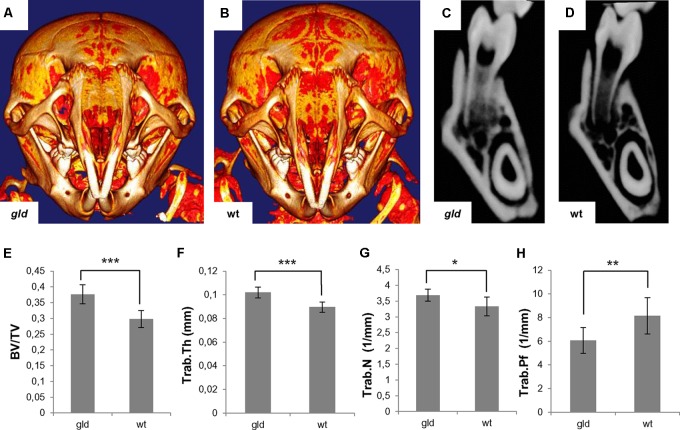
FIGURE 6.
Analysis of postnatal (P24) jaw bone of gld mice. Increased mineralization in gld (A) compared to wild-type mouse (B) where bright color shows increased mineralization, frontal section of the mandible of gld (C) and wild-type mice (D), increased BV/TV ratio in gld mice (n = 6 animals) compared to wild-type mice (n = 6 animals), avggld = 0.3763 mm3, sdgld = 0.0301 vs. avgwt = 0.2978 mm3, sdwt = 0.0268, p = 0.0008, Student’s t-test, two-tailed (E), increased Trab.Th in gld mice (n = 6 animals) compared to wild-type mice (n = 6 animals), avggld = 0.1020 mm, sdgld = 0.0046 vs. avgwt = 0.0896 mm, sdwt = 0.0043, p = 0.0007, Student’s t-test, two-tailed (F), increased Trab.N in gld mice (n = 6 animals) compared to wild-type mice (n = 6 animals), avggld = 3.6872 1/mm, sdgld = 0.1874 vs. avgwt = 3.3277 1/mm, sdwt = 0.2954, p = 0.0152, Mann–Whitney test (G), decreased Trab.Pf in gld mice (n = 6 animals) compared to wild-type mice (n = 6 animals), avggld = 6.0641 1/mm, sdgld = 1.0851 vs. avgwt = 8.1548 1/mm, sdwt = 1.5312, p = 0.0087, Mann–Whitney test (H). ∗p ≤ 0.05, ∗∗p ≤ 0.01, and ∗∗∗p ≤ 0.001.

