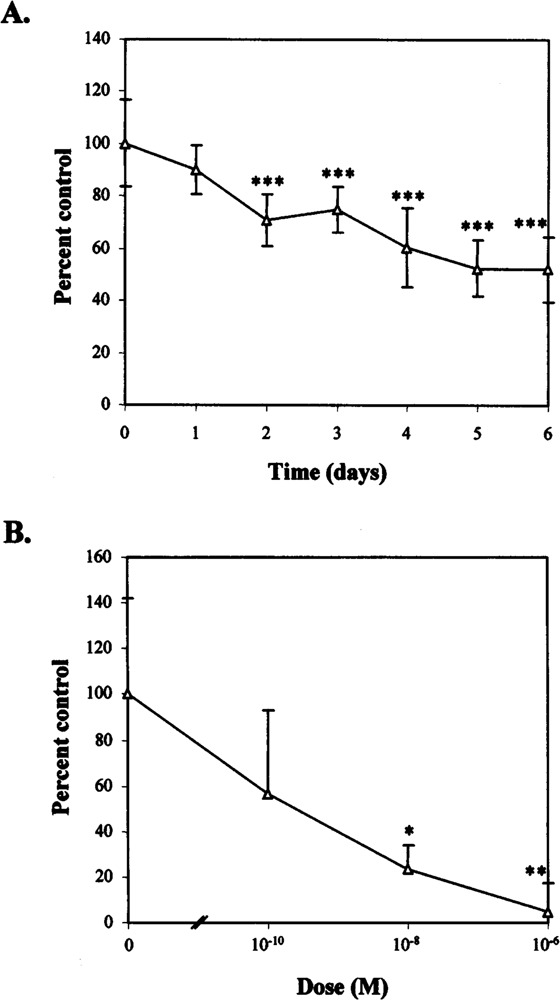
FIG. 8.

Growth in response to dexamethasone. (A) Using the MTS assay. TT cells were treated with 10−6 M dexamethasone or with an equivalent amount of ethanol for up to 6 days. MTS assays were performed daily and background readings subtracted from each day’s result. Treatment results are presented here as a percentage of vehicle-treated control lanes ± 1 SD (n = 8). Significant differences when compared to control samples are shown: *p < 0.05, **p < 0.01, ***p < 0.005. (B) Using the [3H]thymidine uptake assay. TT cells were treated with either 10−6 M dexamethasone or vehicle for 24 h. [3H]Thymidine was then added for the final 4 h of this incubation and the uptake assay performed. Treatment results are presented, minus background readings, as a percentage of vehicle-treated control lanes ± 1 SD (n = 3). Significant differences are shown as in (A).
