
FIGURE 1.
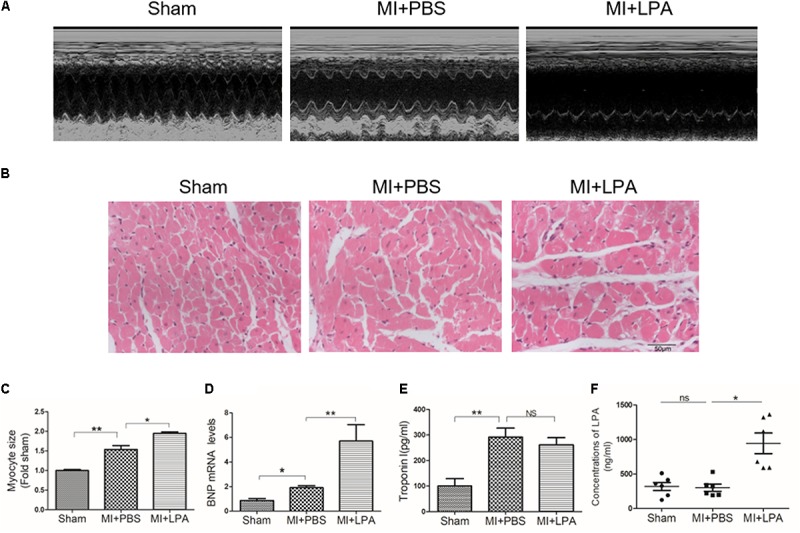
Lysophosphatidic acid (LPA) aggravates cardiac dysfunction and hypertrophy in vivo. (A) Representative M-mode echocardiography images of hearts in each group. (B) Representative hematoxylin and eosin staining of cardiac tissue section in each group. Scale bars, 50 μm. (C) The analysis of myocyte size. n = 4 rat per group, ∗P < 0.05, ∗∗P < 0.01. (D) The analysis of BNP mRNA levels, n = 4 rat per group, ∗P < 0.05, ∗∗P < 0.01. (E) The Elisa assay was used to determine the troponin I concentrations in plasma, n = 4 rat per group, ∗∗P < 0.01, NSp > 0.05. (F) The Elisa assay of the LPA concentrations in plasma 5 weeks after MI, n = 6 rat per group, ∗∗∗P < 0.001, NSp > 0.05. All data were presented as mean ± SEM. One-way ANOVA followed by a Tukey’s post hoc was used for multiple testing.