
FIGURE 4.
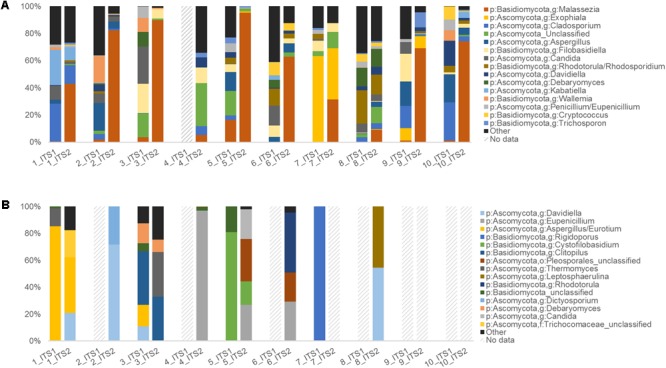
Human upper respiratory and mouse gut ITS data summaries. Taxonomic summary plots comparing ITS1 and ITS2 sequence data for (A) human sinonasal (n = 10) and (B) mouse fecal samples (n = 10), with taxonomic assignments conducted using the RDP ITS reference database. Dashed-line bars indicate samples that did not amplify sufficiently and/or meet the sequence subsampling threshold of 1000 reads per sample.