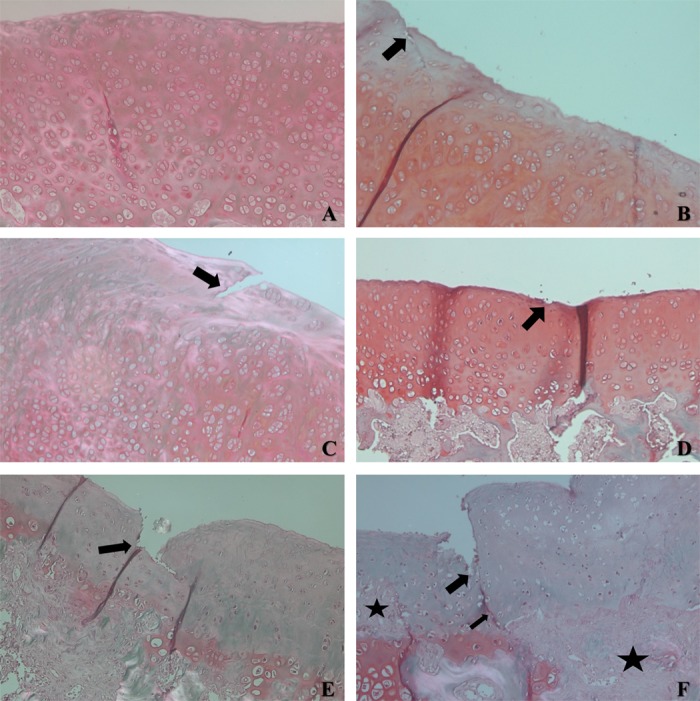
FIGURE 7.

Sections of articular cartilage with different grades of degenerative changes in OA classified using OARSI scoring system. (A) Example of the CONTROL group - Grade 0 - normal cartilage. (B) Example of PROF250 group - grade 1, indicates intact surface with slight discontinuity in surface area (arrow). (C) Example of SR250 group - grade 3, demonstrates vertical fissure in superficial layer (arrow). (D) Example of SR500 group – grade 1, with slight discontinuity in surface area (arrow). (E) Example of SAL group - grade 4, with erosion reaching mid layer. (F) Example of SAL group - grade 5, with ulceration and fissure reaching the deep layer of articular cartilage (arrow), with areas of fibrocartilaginous repair (stars).
