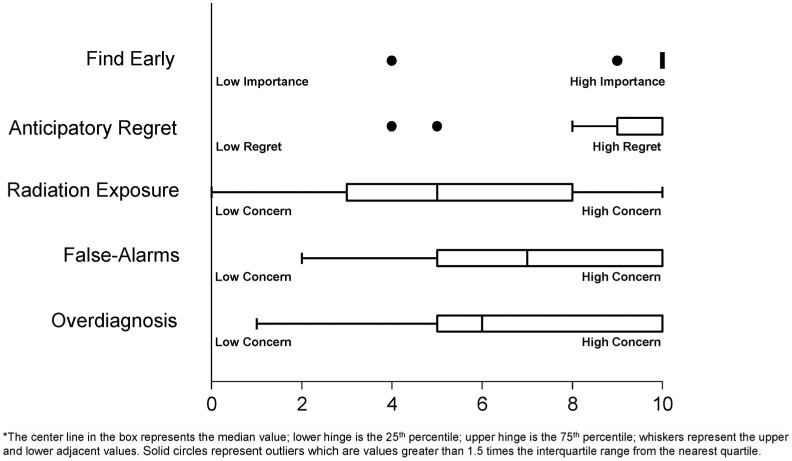
Figure 2.
Current and former smokers’ ratings of the value (i.e., importance) of potential risks of lung cancer screening with low-dose computed tomography; medians, interquartile ranges, and outliers. The box represents the interquartile range (IQR), with the center line in the box representing the median value; whiskers representing the data points within 1.5 IQR on the upper and lower ends; and solid dots representing outliers that are values outside 1.5 IQR. For Find Early, responses are clustered at 10, represented by the bolded bar.

