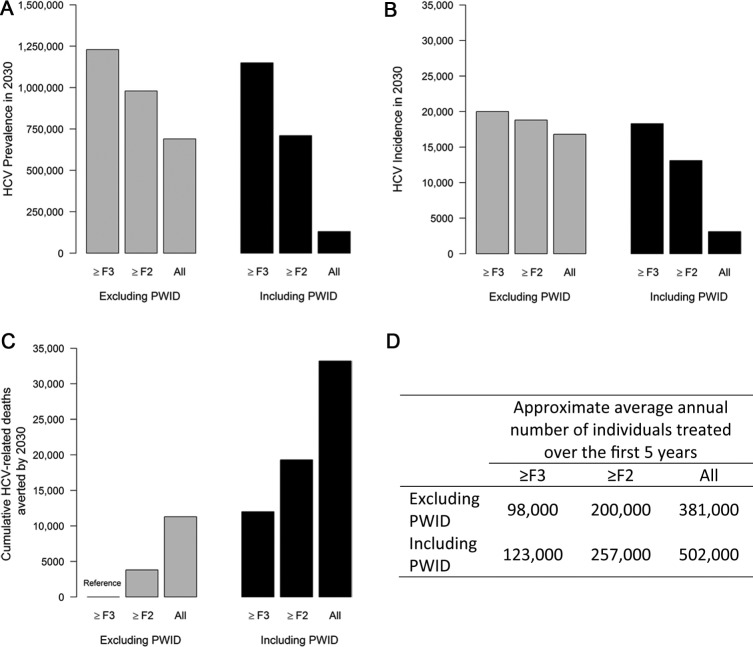
Figure 4.
Population health and health economic model of HCV in the US performed by Moreno and others.53 (A) HCV prevalence in 2030; (B) Annual HCV incidence in 2030; (C) Cumulative HCV-related deaths averted comparing HCV treatment expansion policies using different minimum fibrosis-stage thresholds (≥F3, ≥F2, and treat all) and the inclusion or exclusion of PWID; (D) Approximate average annual number of individuals treated over the first 5 years. Note that the total number of people treated each year differs across scenarios.

