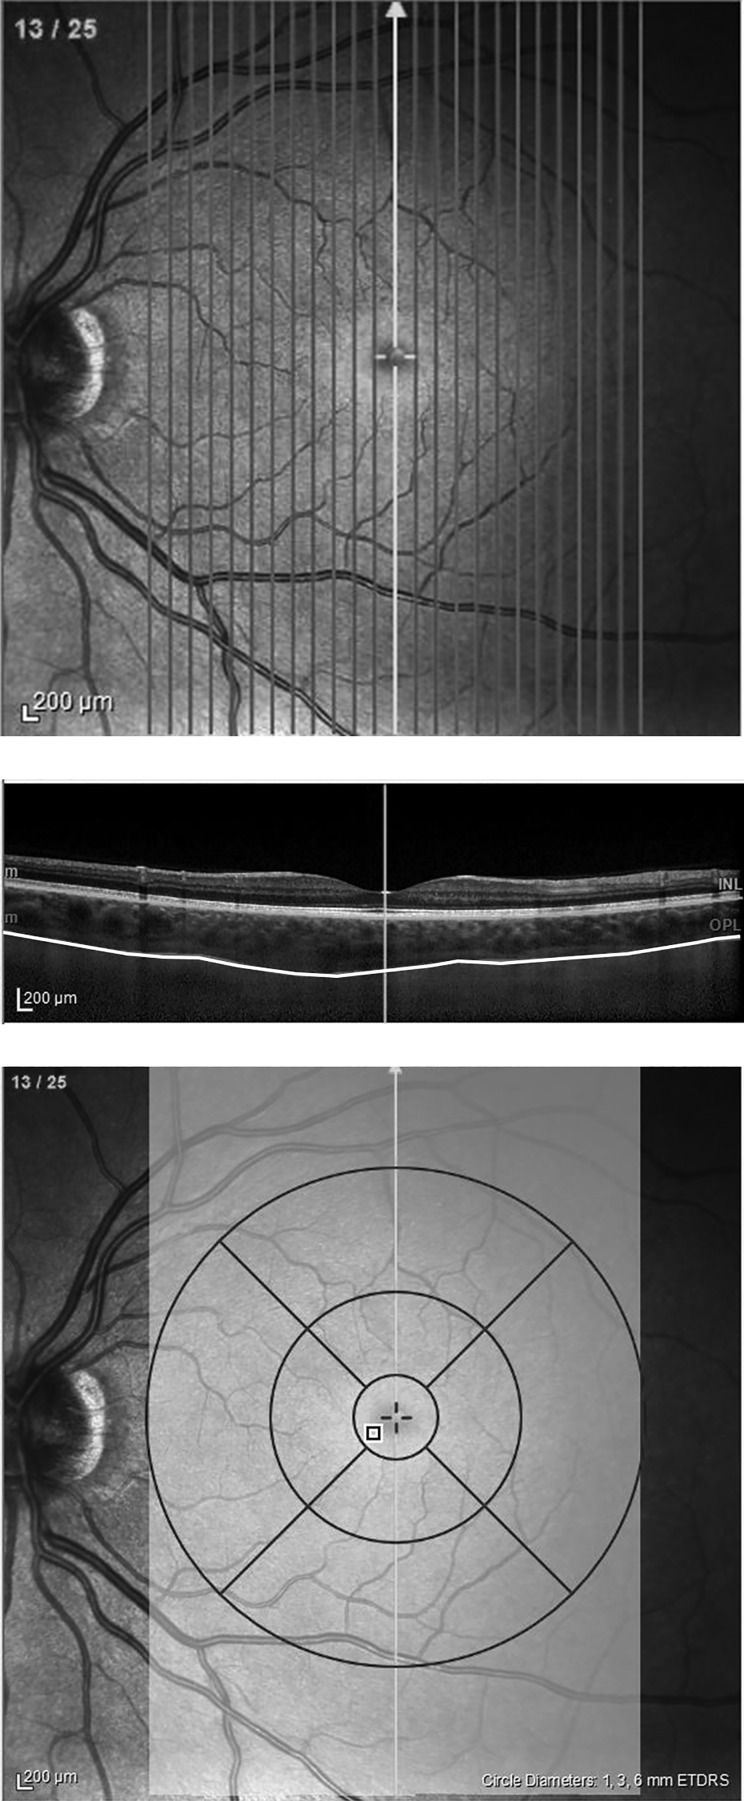
Fig. 2.
Choroidal volume scan using optical coherence tomography. A total of 25 single line scans were taken centered on the fovea (top). Each line scan was manually segmented to determine the top and bottom of the choroid layer (middle). The choroidal volume calculation was restricted to a 6-mm diameter circular region centered on the fovea (bottom).

