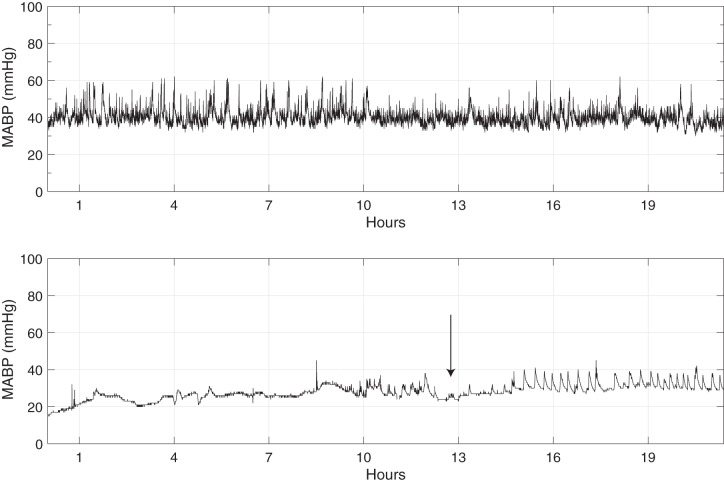
Fig. 1.
Two examples traces of the raw MABP are shown, each ~20 h in length. The difference in variability is visually apparent between a control group infant who did not require inotropes (top) and 1 who did (bottom). The arrow at bottom denotes initiation of inotropic medications; note, over the next several hours, there is increased variability in the blood pressure that emerges.

