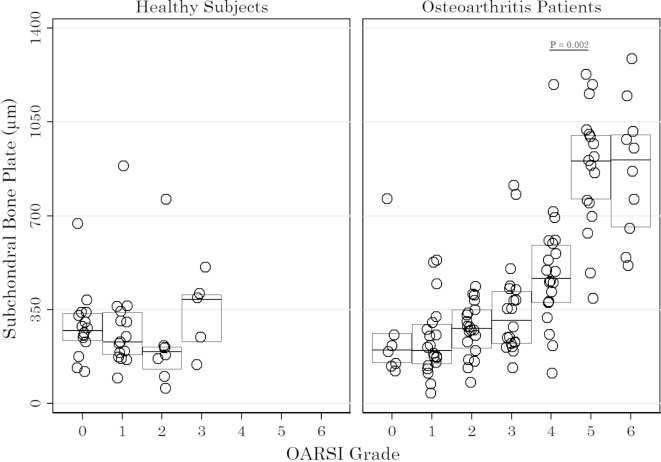
Figure 3.
The thickness of the subchondral bone plate for healthy subjects and patients with osteoarthritis (OA). Each circle represents the subchondral bone plate thickness categorised according to the OARSI grades 0–6 in an individual. The horizontal line indicates the median while the IQR is represented by the boxes. One-way analysis of variance for ThSCB according to OARSI grade was significant for the patients with OA (F(6, 107)=23.23, p<0.001) but not for healthy subjects (F(3, 39)=1.34, p=0.274). The p values indicated are the result of post hoc Bonferroni test. P<0.05 was considered significant. OARSI, Osteoarthritis Research Society International.

