
Figure 2. Typical results for three different microvolume spectrophotometers.
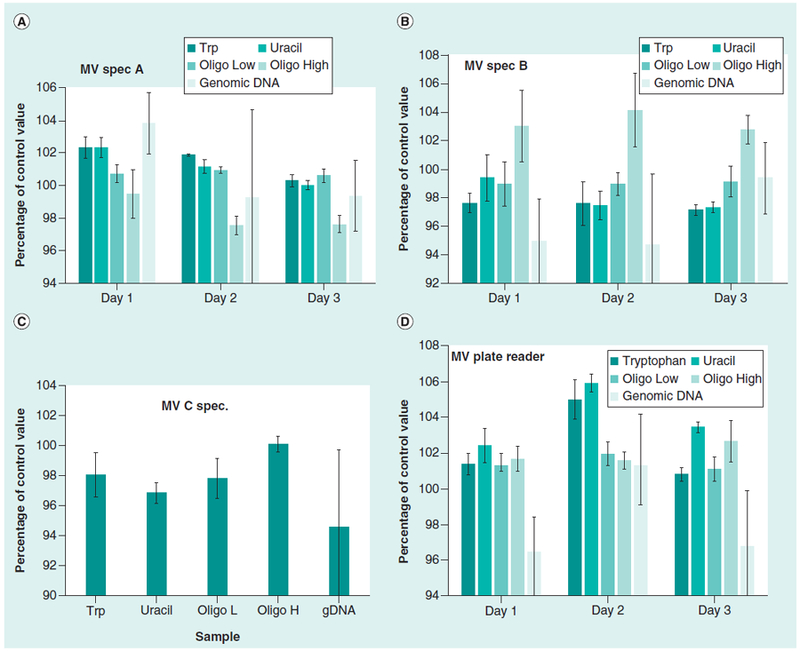
Results from MV Spec A is shown in (A), MV spectrophotometer B is shown in (B), MV spectrophotometer C is shown (C), and the MV plate reader is shown in (D). The error bars are 1 CV (%). The data for these measurements are summarized in Table 3.