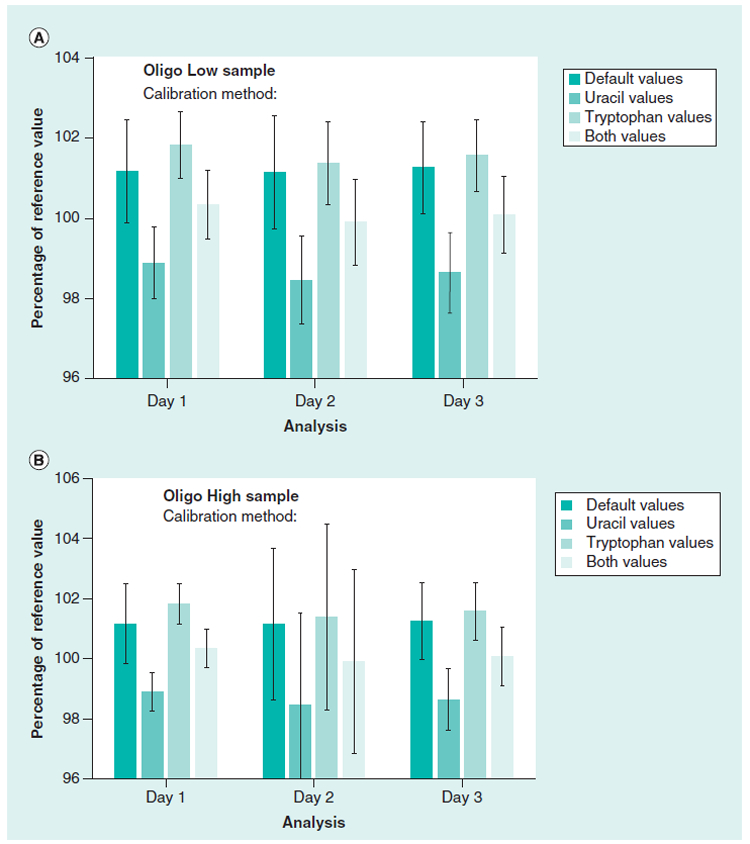
Figure 3. Comparison of the absorbance values of the Oligo Low and Oligo High concentration samples using the default pathlength calibration and SRM 2082 to calculate pathlengths for the microvolume plate reader.

The path length values for the 16-well plate were calculated using either uracil, tryptophan, or the average of both to calculate the absorbance values for the oligonucleotide low and high concentration samples. Values were compared to the default instrument (factory) values. Values were from three different days using three measurments per sample in the 16 wells. The error bars are 1 CV (%).
