Figure 1:

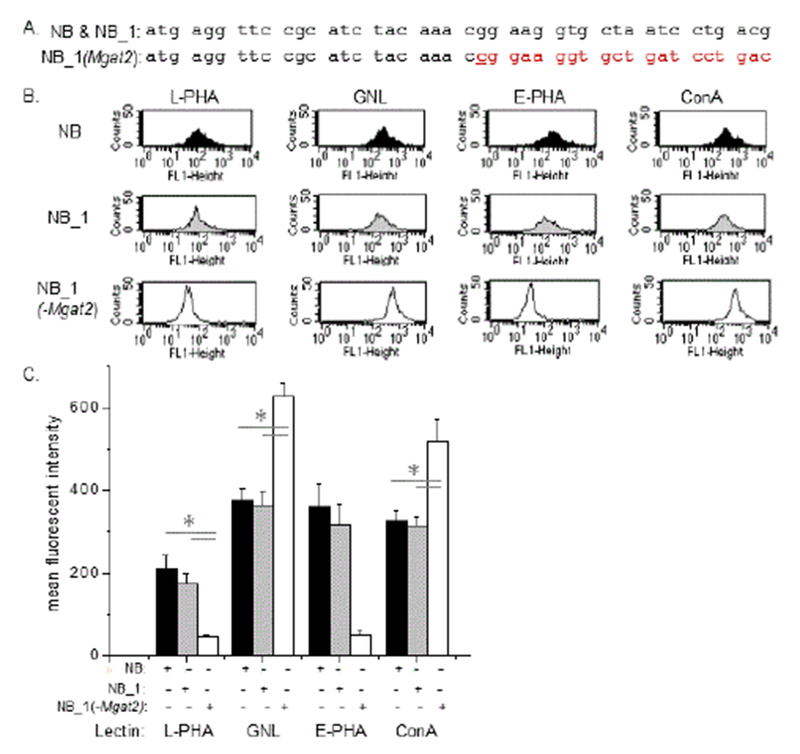
Characterization of neuroblastoma cell lines with differences in the N-glycosylation pathway. CRISPR/Cas9 technology was employed to silence the Mgat2 gene in a clonal cell line (NB_1) isolated from NB cells. The coding sequence (CDS) of the Mgat2 gene from 1 to 42 is shown for the NB cell line which matched the NB_1 cell line, and the isolated clonal cell line, NB_1 (-Mgat2) (A). NB_1 (-Mgat2) has the Mgat2 gene silenced, resulting from insertion of c after the 22nd nucleotide. This inserted nucleotide is denoted in bold red font and the red font reveals the different codons in the sequence. Representative flow cytometry plots of fluorescently labelled lectins bound to NB (top panels), NB_1 (middle panels), and NB_1 (-Mgat2) (bottom panels) cell lines (B). The lectins were L-PHA (left panels), GNL (left middle panels), E-PHA (right middle panels), and ConA (right panel) (B). Mean fluorescence values of the various neuroblastoma cell lines (C) were ascertained from 6 separate lectin binding experiments for L-PHA, GNL, and E-PHA, and 4 experiments for Con A. (*) denote that NB_1 (-Mgat2) was significantly different from NB and NB_1 at a probability of P<0.05 using One-way ANOVA with Bonferroni adjustments.
