Figure 3:

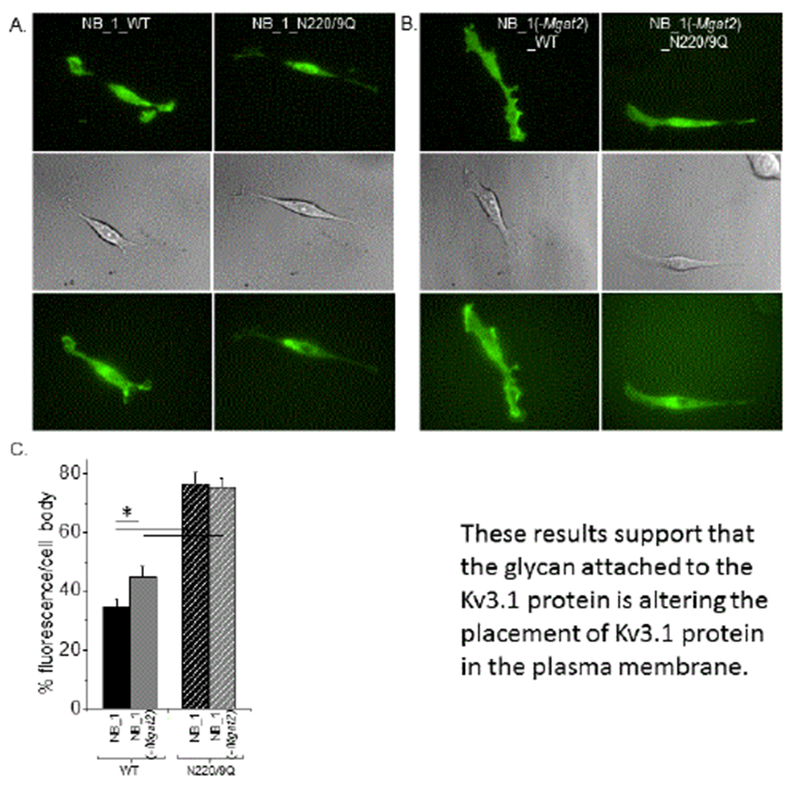
Subdomain localization of Kv3.1b in neuroblastoma cells with different N-glycosylation pathways. Microscopy images were obtained in TIRF (upper panels), DIC (middle panels) and wide-field (lower panels) modes for various forms of EGFP tagged Kv3.1b protein. Glycosylated (left panels) and unglycosylated (N220/9Q; right panels) Kv3.1b expressed in NB_1 (A) and NB_1 (-Mgat2) (B). Representative scale bar (5 μM) was similar for all acquired images. Percent fluorescence in the cell body of NB_1 cells expressing either glycosylated or unglycosylated Kv3.1b relative to NB_1 (-Mgat2) cells expressing the two different forms of Kv3.1b (C). Experiments were performed on at least 3 different days and at least 45 cells were examined in each group. Asterisks indicate significant differences in mean values at a probability of P<0.05 using unpaired student T-test.
