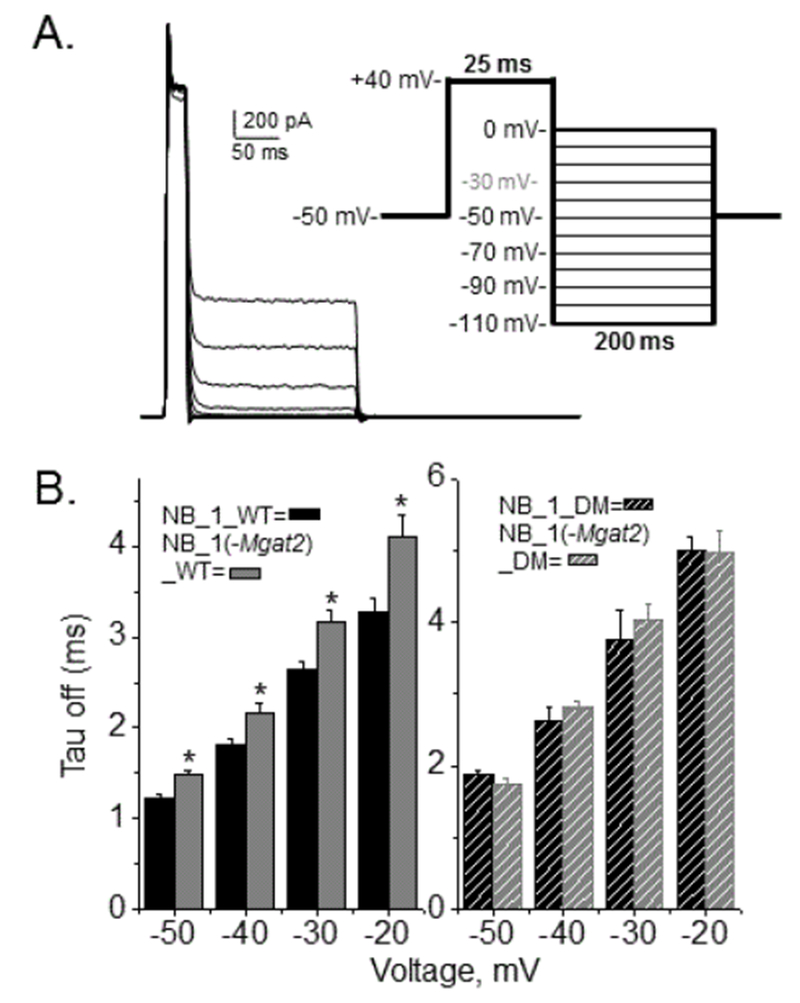
Figure 7:

Deactivation rates of ionic currents for the Kv3.1b channel expressed in NB cell lines with different N-glycosylation pathways. Deactivation currents were elicited from the accompanied voltage protocol for NB_1 cells expressing glycosylated Kv3.1b (A). Black line denotes current at −30mV. Bar graphs revealing deactivation rates of glycosylated KV3.1 (B, left panel) and unglycosylated Kv3.1 (B, right panel) among the cell lines. Experiments were performed on at least 3 different days and at least 5 cells were examined in each group. Asterisk denotes significant differences in mean values at a probability of P<0.05 using student t-test.
