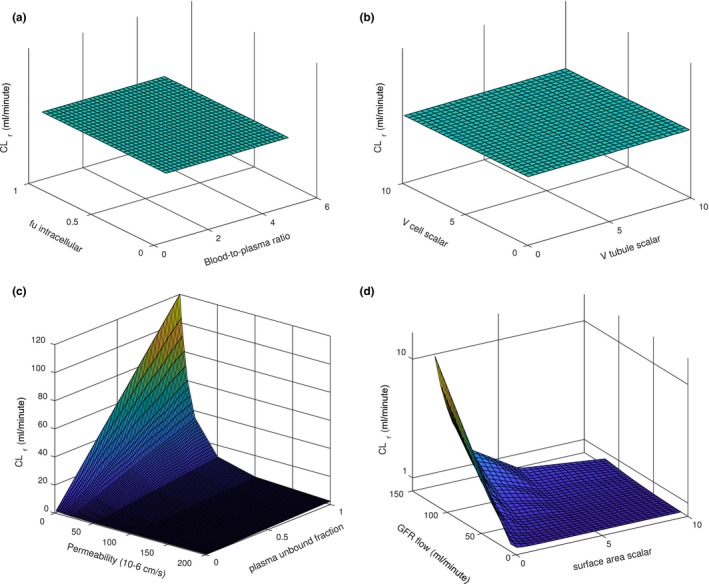
Figure 2.

Sensitivity analysis of the developed kidney model. The sensitivity analysis was conducted using a hypothetical neutral drug with permeability of 10 × 10−6 cm/s and plasma unbound fraction of 0.1 (unless stated otherwise). Panel (a) shows the effects of unbound fraction (0.1–1) inside the renal cell and blood‐to‐plasma ratio (0.5–5) on simulated renal clearance (CLr). Panel (b) shows the effects of tubular volume (0.1–10‐fold) and renal cell volume (0.1–10‐fold) on simulated renal clearance. Panel (c) shows the effects of in vitro permeability (0.1–200 × 10−6 cm/s) and plasma unbound fraction (0.1–1) on simulated renal clearance. Panel (d) shows the effects of glomerular filtration rate (GFR; 15–120 mL/min) and tubular surface area (0.1–10‐fold) on simulated renal clearance.
