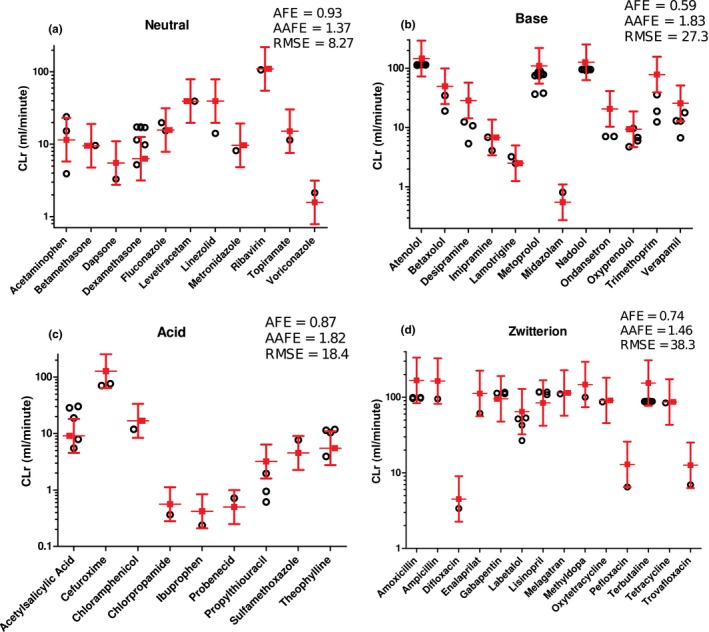
Figure 3.

Simulation of renal clearances (CLr) of 11 neutrals, 12 bases, 9 acids, and 14 zwitterions as verification of mechanistic kidney model. Red symbols represent the observed renal clearances of the test compounds with twofold error range. Black symbols represent the simulated renal clearances using different in vitro permeability values. The comparisons between simulated and observed renal clearances and the average fold error (AFE), absolute average fold error (AAFE) and root mean squared error (RMSE) values for neutral (a), base (b), acid (c), and zwitterion (d) are shown.
