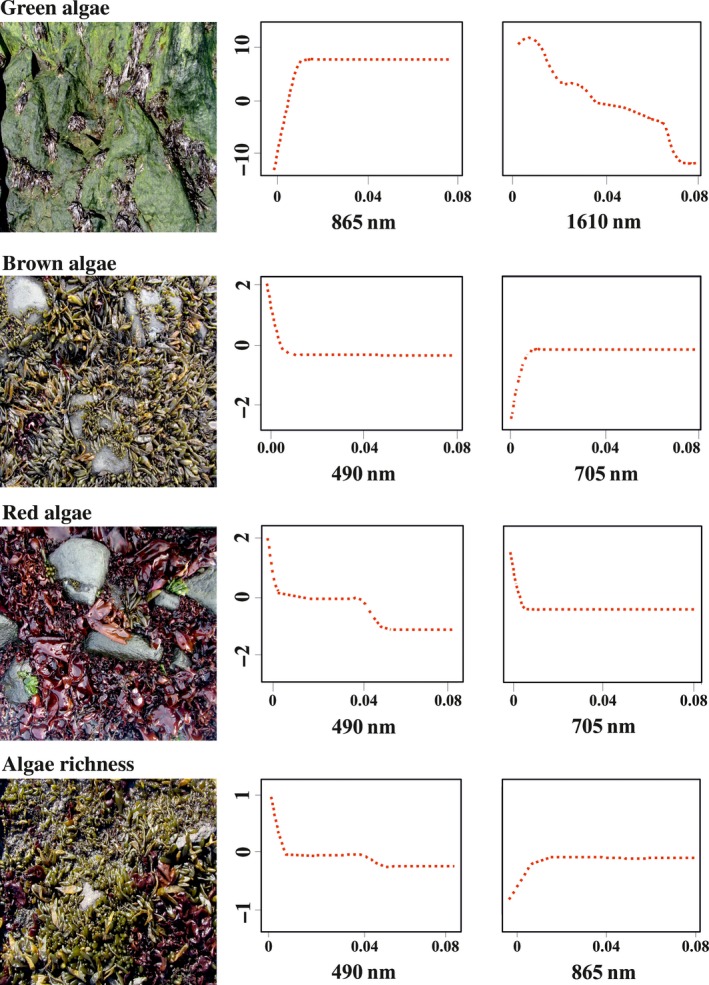
Figure 2.

Left: Photographs of the key intertidal benthic taxa in the study area. Right: Partial dependence plots for the two most influential remote sensing variables (x‐axis: the bottom of atmosphere reflectance at an indicative wavelength) in the model for the cover or richness of different macroalgal taxonomic groups (y‐axis: marginal effect on logit (p)) [Colour figure can be viewed at http://wileyonlinelibrary.com]
