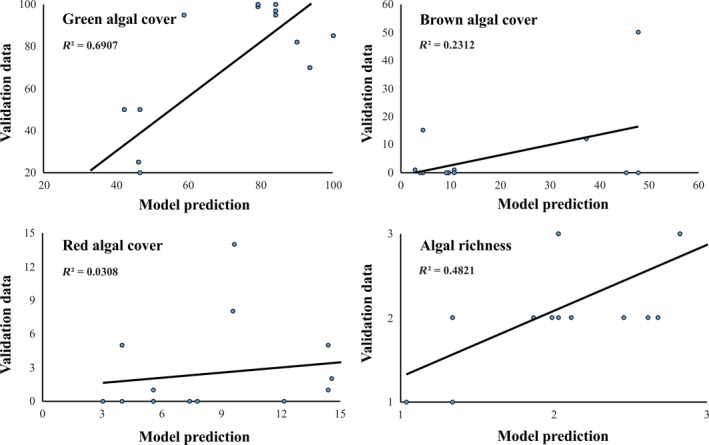
Figure 3.

Interpolation test for assessing the performance of the developed models at different sites for which ground truth data were also available. X‐axis: percent coverage of different macroalgal taxonomic group or macroalgal richness estimated by BRT modeling, and y‐axis: percent coverage of different macroalgal taxonomic group or macroalgal richness estimated during a separate field survey; R 2: the coefficient of determination of linear regression fitting [Colour figure can be viewed at http://wileyonlinelibrary.com]
