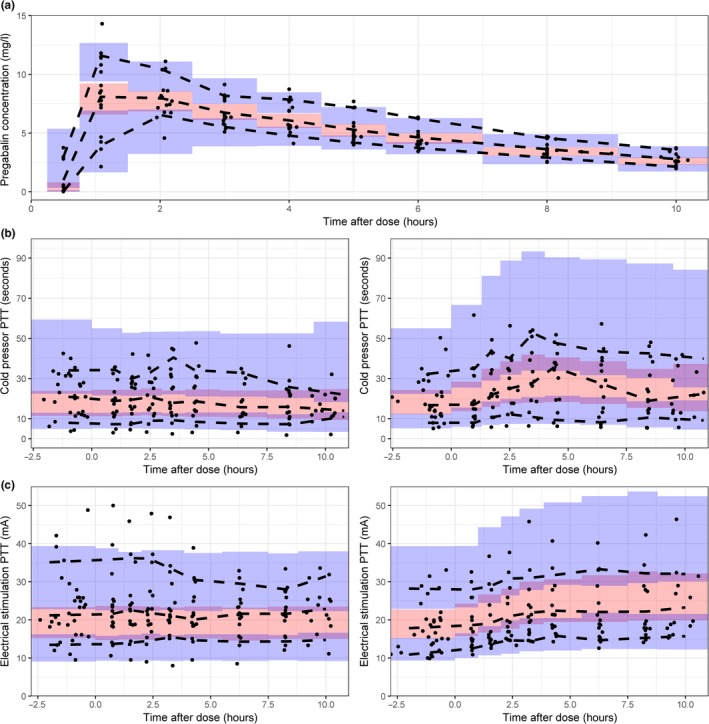
Figure 3.

Visual predictive checks of 500 samples of the population pharmacokinetic (PK) (a), the cold pressor pain tolerance threshold (PTT) (b), and the electrical stimulation PTT (c) after administration of a single oral dose of 300 mg pregabalin. For the pharmacodynamic outcomes, the left figure indicates the placebo occasion, the right figure indicates the pregabalin treated occasion. Black dots = observations, black dashed lines = 80% confidence interval (CI) and median of the observations, red shaded area = 95% CI of the median prediction, blue shaded area = 95% CI of the 10th and 90th percentiles.
