
Figure 2.
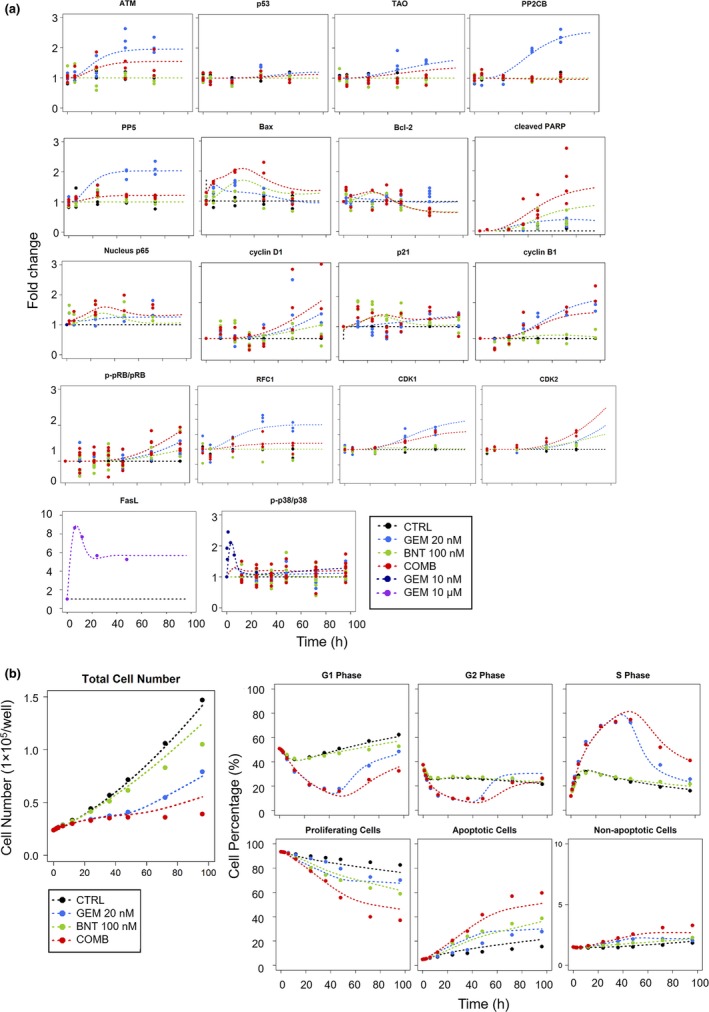
Observations in PANC‐1 cells and fittings based on the network model of Figure 1. Treatment groups included control (CTRL, black), 10 nM, 20 nM, 100 μM gemcitabine (GEM, blue), 100 nM birinapant (BNT, green), and 20 nM/100 nM gemcitabine/birinapant combination (COMB, red). (a) Temporal fold‐change in the abundance of selected protein nodes, and (b) total cell numbers (proliferation) and cell cycle distributions in G0/G1‐, S‐, G2/M‐phases, and in apoptosis. Experimental observations are represented by symbols, and fittings based on the multi‐scale network model (Figure 1) are indicated by curves. Model parameters are listed in Table 1.