
Figure 3.
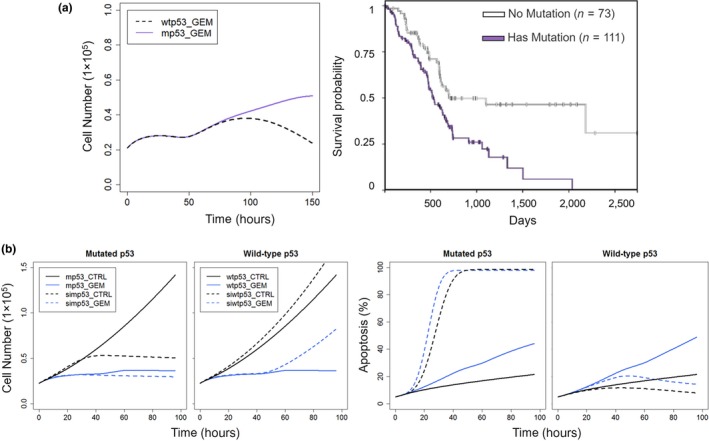
Model‐based predictions of impact of p53 mutations and silencing on gemcitabine‐mediated inhibition of cell proliferation of PANC‐1 cells. (a) Left: Simulations of cell proliferation during exposure to 20 nM gemcitabine in cells with mutant p53 (mp53; purple) and wild‐type p53 (wtp53; black). Right: Kaplan Meier plot showing survival of 184 pancreatic cancer patients in PAAD study with mp53 (purple) and wtp53 (black), generated from the TCGA database using UCSC Xena (https://xenabrowser.net/heatmap/). Abscissa represents days of survival from diagnosis. (b) Silencing p53 shows opposing effects upon cell proliferation and induction of apoptosis by gemcitabine in cells with mp53 vs. wtp53. Profiles of cell numbers (left) and percentage of apoptotic cells (right) in cells with mp53 (solid line) and silenced mp53 (simp53; dashed line) or wtp53 (solid line) and silenced wtp53 (siwtp53; dashed line) in control cells (black) and the presence of 20 nM gemcitabine (blue).