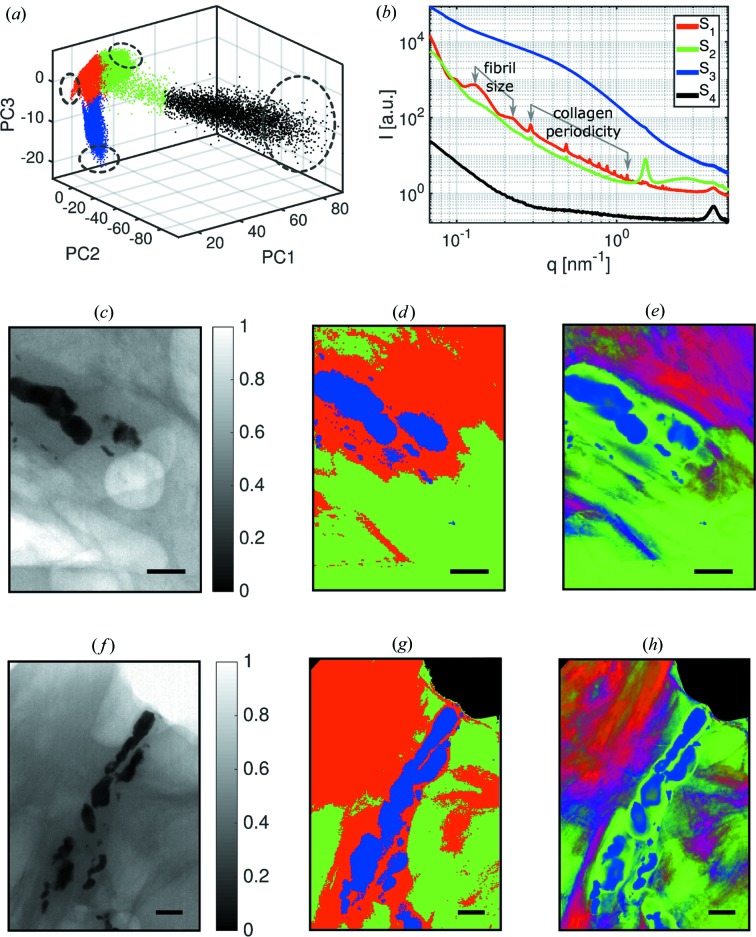
Figure 5.
Results of scanning SAXS measurements of breast lesions. (a) The data set is classified into four clusters. (b) The representative signals for each cluster indicate that the breast tissue is segmented into regions that are rich in collagen (S 1), lipids (S 2), microcalcifications (S 3) and Kapton (S 4). S 4 is recovered as a region of pure Kapton at the sample. Benign breast lesion: (c) Transmission map of the benign sample. (d) Image segmentation. (e) Correlation maps that indicate misclassification of signals near the interface of clusters of lipid-rich and collagen-rich regions, showing the regions of transition between clusters. Malignant breast lesion: (f) Transmission map of the malignant sample. (g) The segmentation shows a clear separation of the sample into four main regions, including the Kapton corners S 4 from sample preparation. (h) Correlation map that emphasizes collagen-rich and lipid-rich classification of the malignant tumor.

