Figure 3.

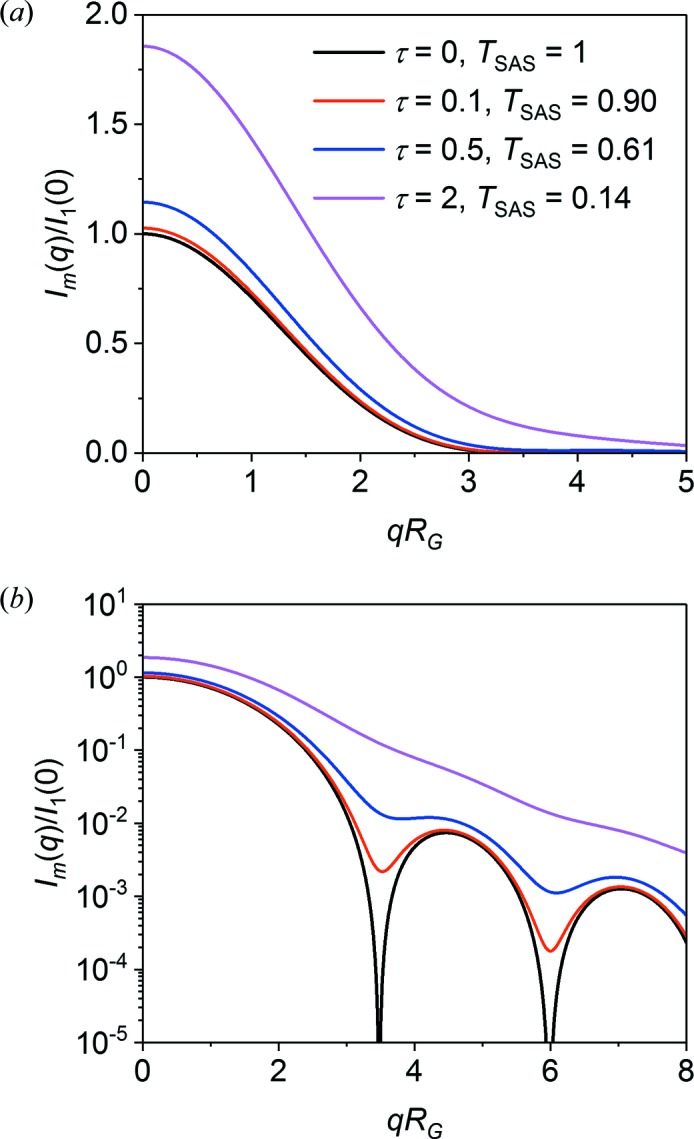
Plots of the multiple scattering function I m(qRG) for monodisperse spheres and scattering powers τ = 0, 0.1, 0.5 and 2.0. Panel (b) shows I m(q) on a log scale to enhance the minima in the scattering function.

Plots of the multiple scattering function I m(qRG) for monodisperse spheres and scattering powers τ = 0, 0.1, 0.5 and 2.0. Panel (b) shows I m(q) on a log scale to enhance the minima in the scattering function.