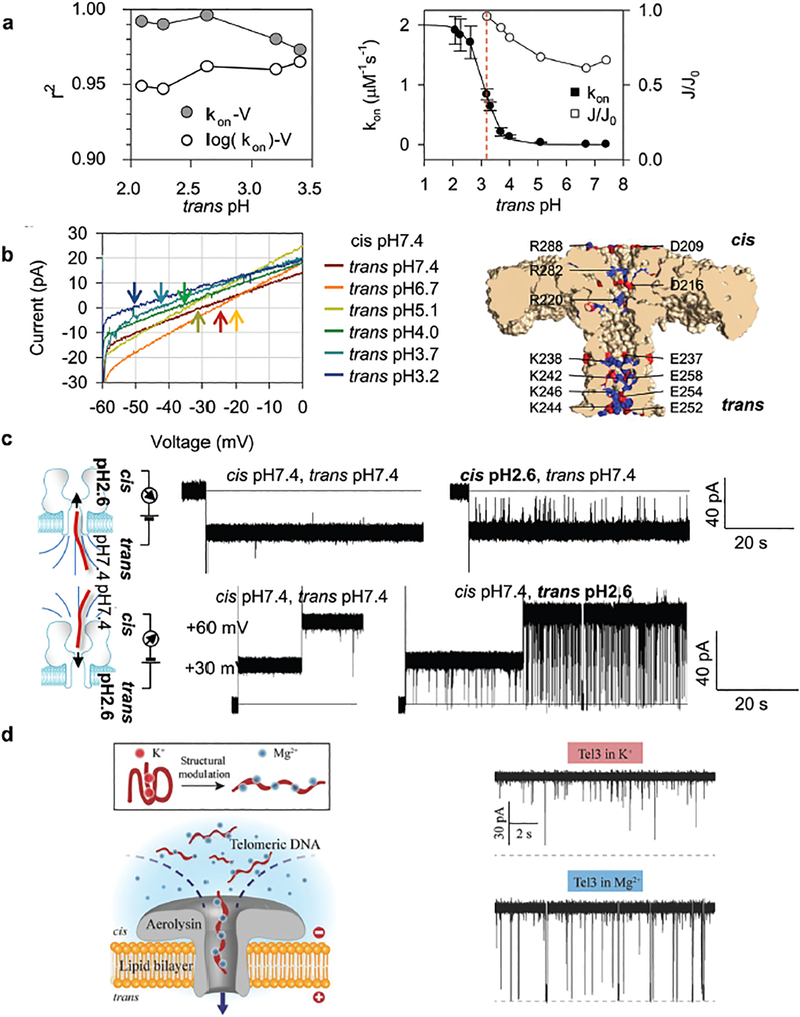
Fig. 5.
(a) Comparison of regression coefficients (r2) for linear regression fitting of kon–V curves on the linear kon scale and on the log kon scale (left); the trans pH-dependent relative net anion flow J/J0 and the kon-trans pH curve (right). (b) Current–voltage (I–V) curves of aerolysin at various trans pH. Arrows in different colors mark the reverse potential (Vr) (left); a cartoon showing charge distribution at the cis and trans entrance (right). (c) Trapping of a 16 nt DNA from trans (up panel) or cis (bottom) while lowering the pH at the trans or cis side in the alpha-hemolysin pore. Reprinted with permission from DOI: 10.1021/acs.analchem.7b03979, Anal. Chem., 2017. (d) A cartoon showing a G-quadruplex structure unfolding into a linear format (left) and its capturing (10 μM) in the aerolysin pore (right, K+ (upper) or Mg2+ (bottom)). Reprinted with permission from DOI: 10.1002/smll.201704520, Small, 2018.

