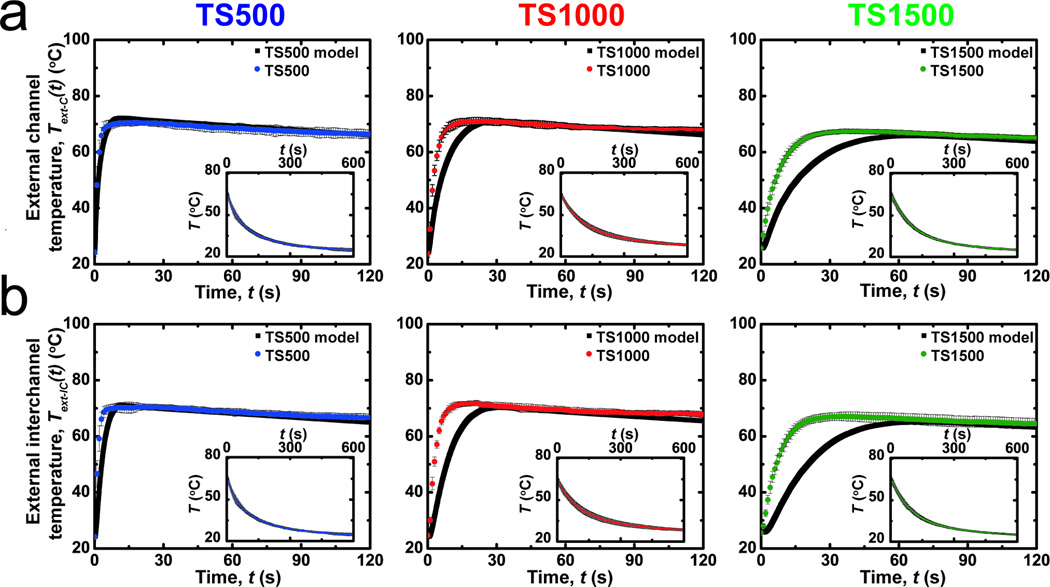
Figure 5.
A comparison of the experimental and predicted temperature profiles of microfluidic thermally activated materials perfused with media at 80 °C (n = 3). Temperatures are measured on the surface of test structures directly (a) above the centerline above microfluidic channels (Text-C) or (b) above the centerline between adjacent microfluidic channels (Text-IC). Insets show the cooling kinetics at ambient temperature after 120 s of thermal perfusion. The temporal surface evolution kinetics of the devices accelerates as the effective thermal diffusion length scale λ decreases. The fit between experimental and predicted external temperatures varies inversely with the characteristic thermal diffusion length scale (See text).

