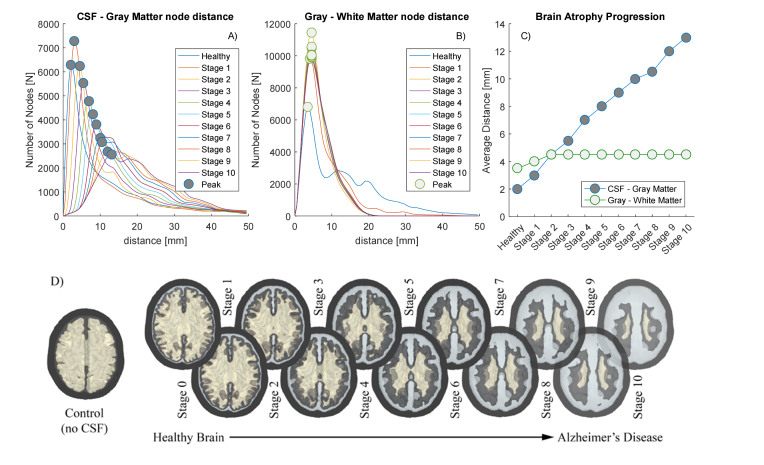
Fig. 3.
Informative about the Alzheimer’s model creation. From the top graphs in panels A-C, it is possible to notice how the shrinkage of the brain is linear with respect the increasing thickness of the resulting CSF layer. Both the GM and the WM were shrunk independently with the same criteria, which results to preserve their average distance (and so the average thickness of the GM). D) The bottom infographics shows a tomographic cut of the models and their respective name used throughout the text.

