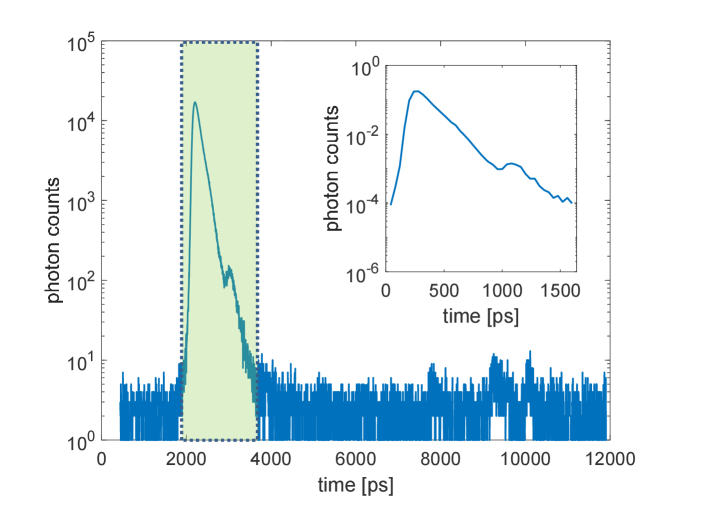
Fig. 5.
IRF used to reproduce realistic laboratory measurements. The main plot shows the measured IRF of a common detector system and on the nested plot its extracted and normalized version (corresponding to the green region in the main graph) that we used to reproduce the effect of a realistic measurement.

