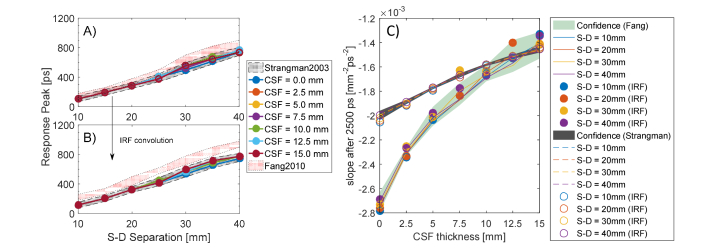
Fig. 7.
CSF fingerprints in the cylindrical model. On the left panel A), the peak response delays as a function of the S-D separation and it resulted to be equal for all the CSF thicknesses investigated. On panel B, the corresponding response delay after the convolution with the IRF that introduces a uniform temporal peak-delay. On the right panel C), the changing in the slope of the late photons due to increased CSF thickness.

