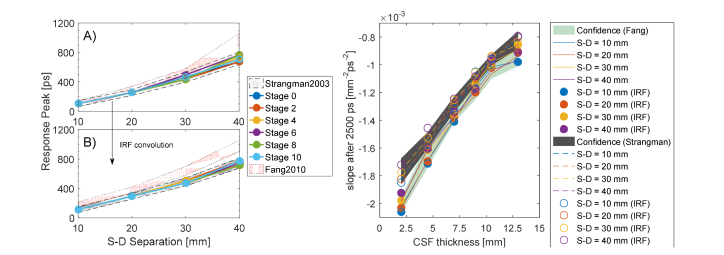
Fig. 9.
Features of the response curves for the Human Head models. A) There is no evident peak shift in the response curves at early detection times as a function of the CSF. The peaks are so close to each other that in the plot all the curves are overlaying each other. B) Even the convolution with the IRF, which shifts up the peak response in time, does not introduce any further visible effect in the measurements. C) Slope variation for late-photons detection as a function of the CSF thickness. In the plot is possible to notice how increased thicknesses of the transparent layer surrounding the brain will affect the reflectance curve, giving useful hints about the possibility to estimate its average thickness.

