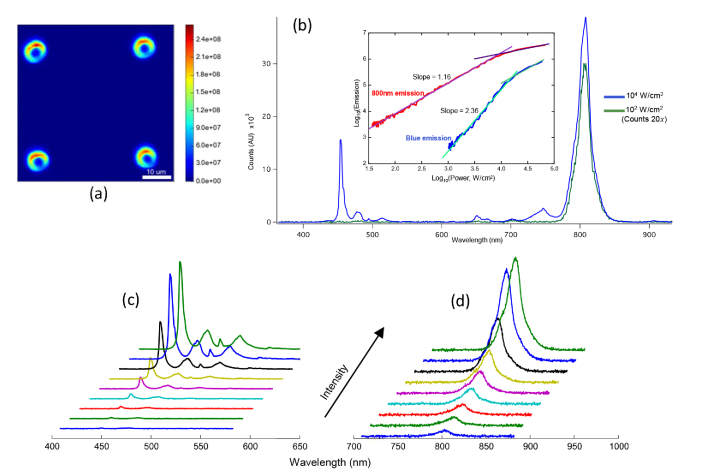
Fig. 5.
(a) Reconstructed confocal scan of MLB emission filtered in the range of λ = 400-900 nm in air. (b) Upconverted emission power dependence for 3H4→3H6 and (1G4→3H6 + 1D2→3F4) Tm3+ transitions, showing two and three photon dependences, respectively, and characteristic power-dependent saturation at high powers. Blue emission waterfall spectra for excitation intensities of 1.1 × 10³, 1.5 × 10³, 1.8 × 10³, 2.4 × 10³, 3.2 × 10³, 4.2 × 10³, 6.5 × 10³, 9.9 × 10³ and 1.1 × 10⁴ W/cm2 shown in (c) and 800 nm emission spectra for excitation intensities of 102, 1.3 × 10², 1.7 × 10², 2.1 × 10², 3.0 × 10², 3.8 × 10², 5.9 × 10², 8.9 × 10² and 103 W/cm2 shown in (d).

