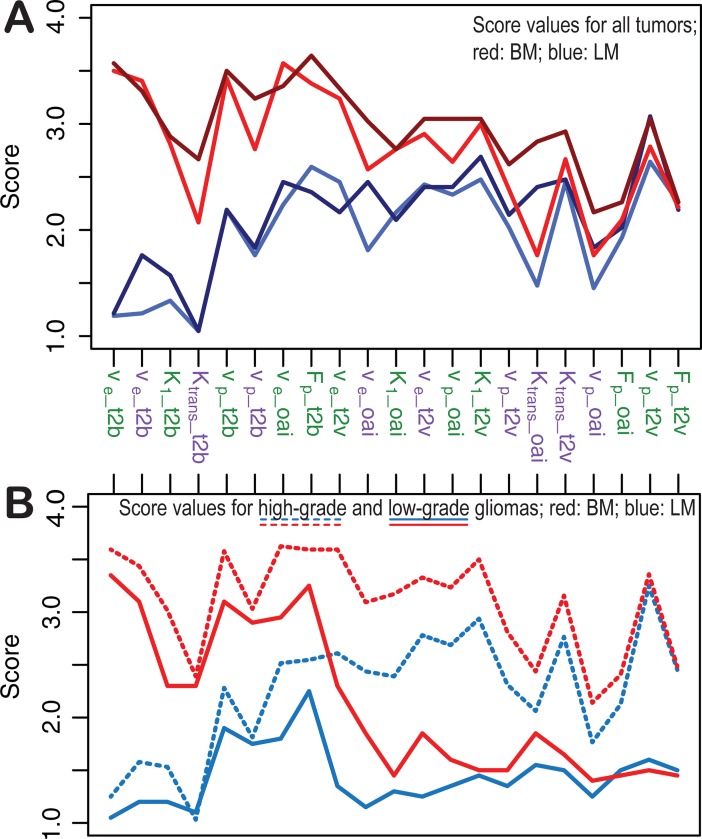
Fig 3.
Observed mean score values in all tumors (A): Images based on the Bayesian model are scored higher (red colors with light red for rater 1 and dark red for rater 2) than those based on the Levenberg-Marquardt method (blue colors with light blue for rater 1 and dark blue for rater 2) for most parameter maps and imaging features. A sub-analysis (B; averaged for both rater) for high-grade (dashed lines) and low-grade gliomas (solid lines) suggests that this is most pronounced for tumor-to-background (t2b) discrimination. Green labels indicate parameters from the 2-compartment-exchange (2CXM), purple labels those from the extended Toft’s model (ETM). t2v: tumor-to-‘surrounding normal vessels’ discrimination; oai: overall impression. Ve: interstitial volume; K1: permeability rate; vp: plasma volume; Ktrans: leakage-flow parameter; Fp: plasma flow.

