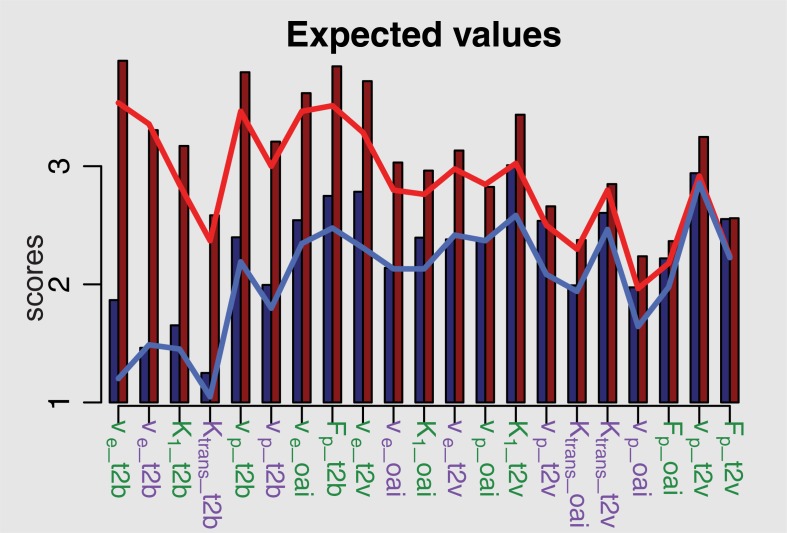
Fig 4. Results of the ordinal mixed model, estimating the predicted scores of image quality, which is generally predicted to be higher using Bayesian modeling (BM, red columns) compared to the Levenberg-Marquardt method (LM, blue columns).
The blue line represents the mean observed values of the LM-based scores, whereas the red shows BM-based mean values. Ve: interstitial volume; K1: permeability rate; vp: plasma volume; Ktrans: leakage-flow parameter; Fp: plasma flow. Green labels indicate parameters from the 2-compartment-exchange (2CXM), purple labels those from the extended Toft’s model (ETM).

