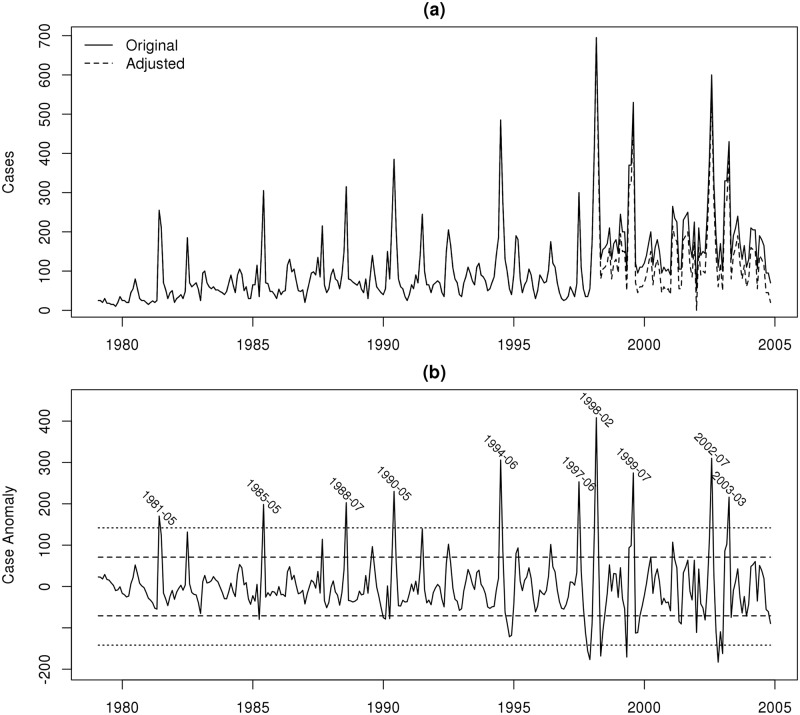
Fig 2.
(a) Number of monthly reported malaria cases at plantation, with dashed line showing adjusted series. (b) Anomaly of cases calculated by removing linear trend from adjusted case series and then applying a one year, high pass filter. Dashed and dotted lines show 1 and 2 standard deviation events, respectively, with positive 2σ events labeled.

