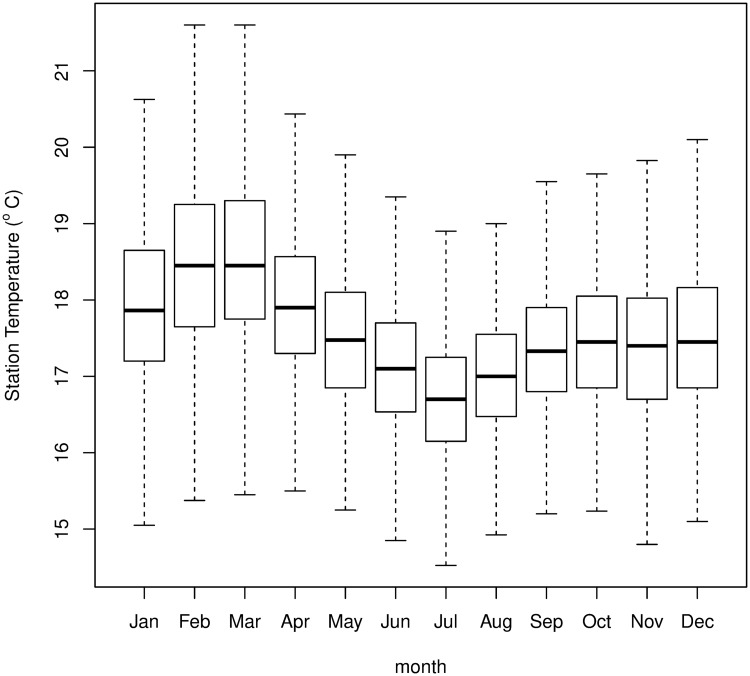
Fig 3. Box-whisker plot of the daily two meter height station temperatures.
The horizontal lines give the mean for a given month over the whole period, the boxes representing the lower and upper quartile limits of the daily temperature, while the whiskers mark the minimum and maximum daily value observed over the whole dataset.

