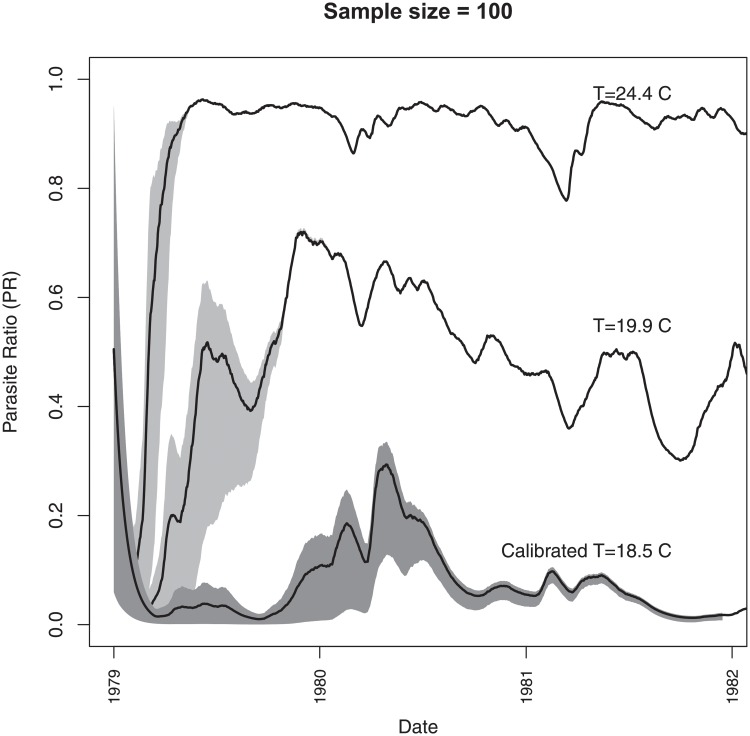
Fig 9. Evolution of PRd for three experiments, each with an ensemble size of 100 integrations that differ only in their initial conditions of PRd, equi-spaced between 0.01 and 1.0.
The gray shading marks the 10 to 90 percentile of the ensemble, and the thick line indicates the ensemble mean. The first experiment uses the calibrated model and climate parameters and has a mean temperature of 18.5°C, while the other two add an additional (arbitrary) temperature offset to give a mean of 19.9 and 24.4 °C, respectively.

