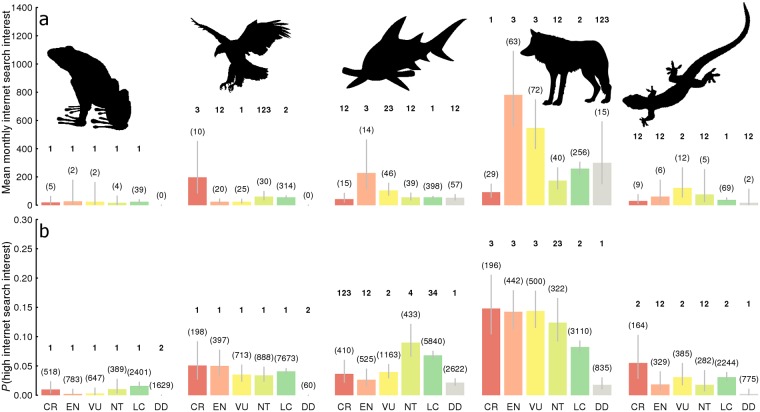
Fig 3. The web search interest of vertebrates compared by Class and Extinction risk (IUCN Red List Status).
a) The average monthly web search interest for species with sufficiently high search volume for Google Trends to return data. b) The probability of a species having a sufficiently high search volume for Google Trends to return data. Bars represent means, error bars represent 95% confidence intervals. Graphs are derived from model predictions made using a negative binomial generalised linear model (a) and a binomial generalised linear model (b) where response = Class*Red List Status. Numbers in parenthesis represent the number of species in each Class*Red List Status combination. Numbers in bold define groups of Red List Status within each class that are significantly different at the 95% confidence level. Any two Red List Statuses within a Class that share a digit cannot be considered significantly different. Letters on the x axis of b denote each Red List Status classification (CR = Critically Endangered, EN = Endangered, VU = Vulnerable, NT = Near Threatened, LC = Least Concern, DD = Data Deficient).

