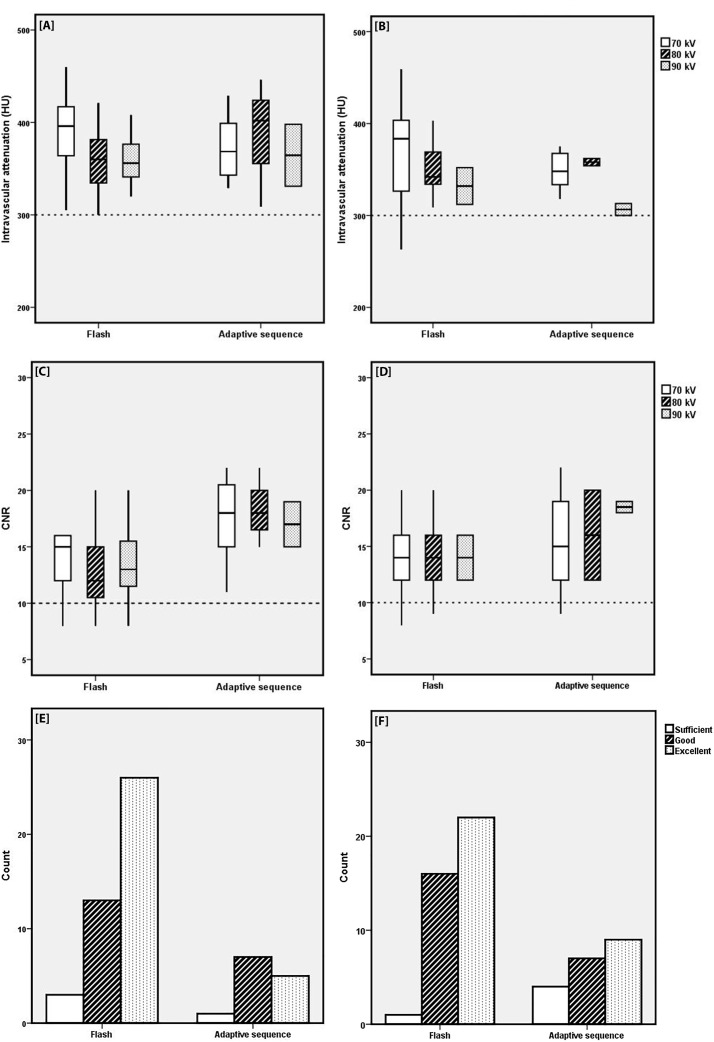
Fig 3.
Attenuation, CNR levels and Likert scale for different scan protocols and different kV settings for men [A-C-E] and women [B-D-F]. [A+B] The overall attenuation was > 300 HU, except for two scans in the high pitch group scanned at 70 kV for women [B]. [C+D] CNR levels were below 10 in 11 scans; 4 scans in both the 70 kV and 80 kV group, 1 scan in the 90 kV group for the high pitch protocol and 2 scans in the 70 kV group for the AS protocol. [E+F] The Likert scales and counts assigned to the two scan protocols. No scan was graded as ‘poor’.

