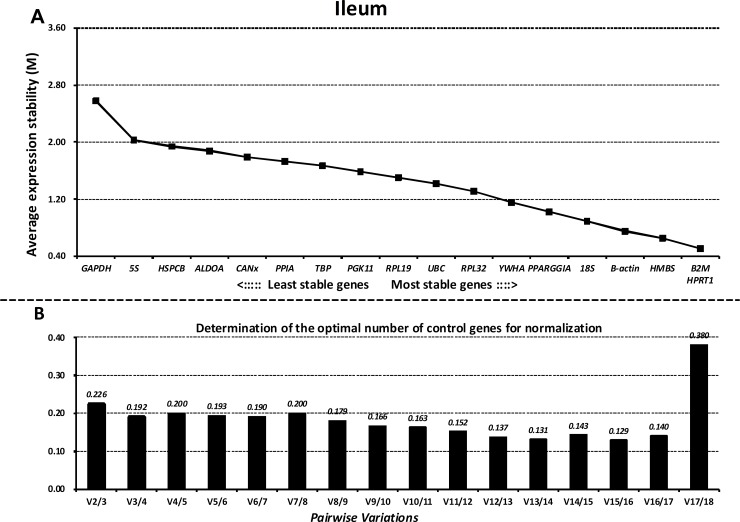
Fig 5. Gene expression stability and rankings of the reference genes in the ileum as calculated by GeNorm.
A) Rank order of gene expression stability based on average expression stability values (M) for the reference genes from least stable (left) to most stable (right). B) Pairwise variation analysis (V) to determine the optimal number of reference genes for RT-qPCR data normalization.

