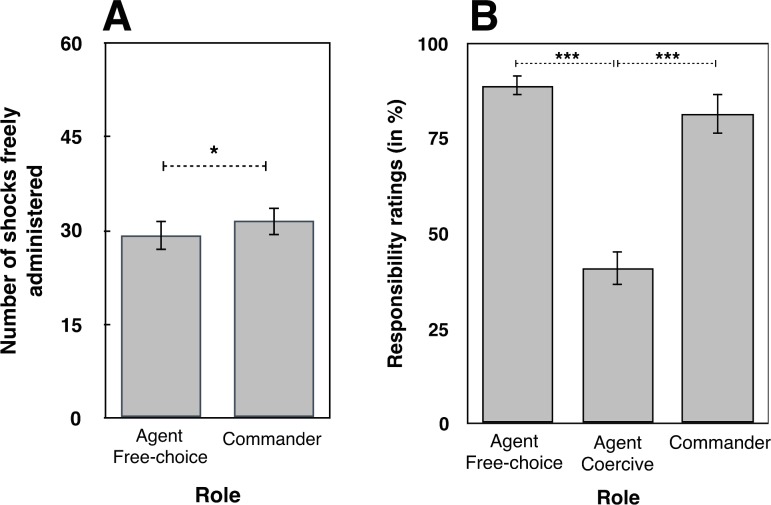
Fig 2.
A) Number of shocks. Number of shocks freely administered by participants when they were in the roles of agent and of commander. B) Responsibility ratings (%) in post-experiment questionnaires. All tests were two-tailed. Errors bars represent standard errors. *** indicates a p value < = .001. * represents a p value between .01 and .05.

