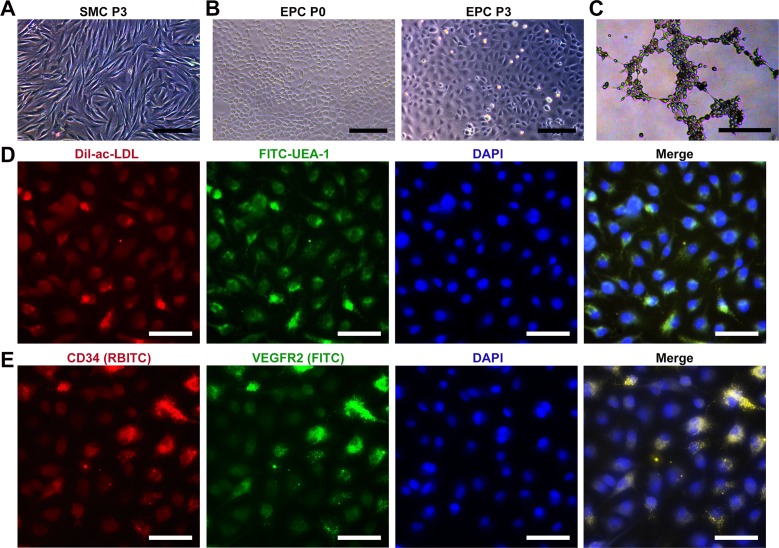
Fig 1. Characteristics of cultured SMCs and EPCs.
(A) Phase contrast image of bladder SMCs at passage 3. (B) Phase contrast images of EPCs at passages 0 and 3, respectively. (C) Tubular network formation of EPCs on Matrigel. (D) EPCs were identified by ac-LDL endocytosis and UEA-1 binding. Nuclei were stained with DAPI. (E) Immunofluorescence images showing CD34 and VEGFR2 expression in EPCs. Nuclei were stained with DAPI. The scale bars show 100 μm in (A), 200 μm in (B, C), and 50 μm in (D, E).

