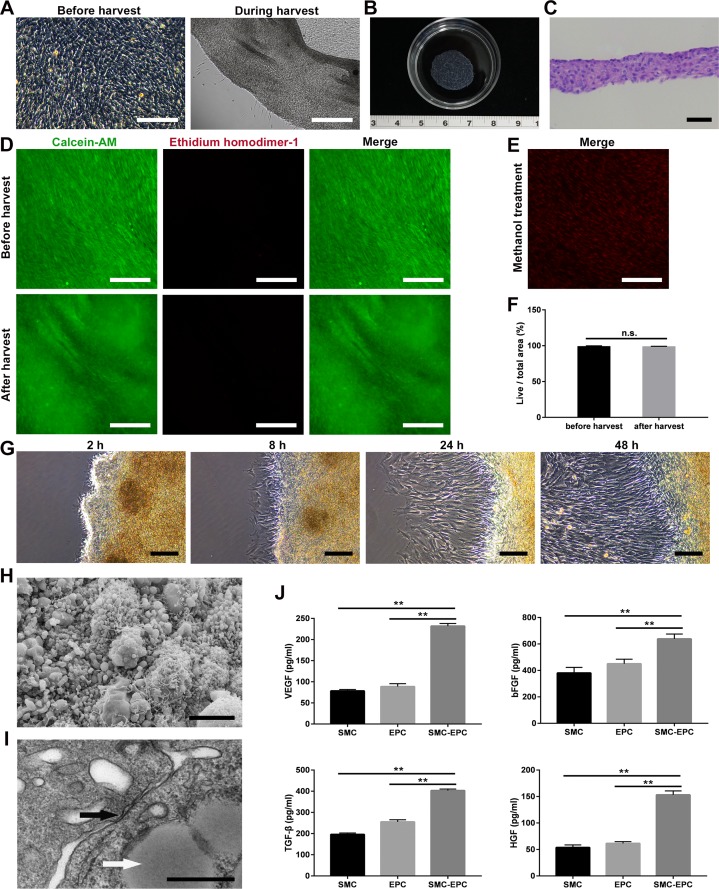
Fig 3. Characteristics of SMC-EPC cocultured cell sheets.
(A) Cocultured cells before and during harvest. (B) Macroscopic image of a cocultured cell sheet. (C) H&E staining of a cocultured cell sheet. (D) Live/dead staining of a cell sheet before and after harvest. (E) Live/dead staining of the cells killed by methanol. (F) Quantitative comparison of the cell viability before and after harvest (n = 6). (G) Microscopic images of a cocultured cell sheet adhered to a new culture dish after 2 h, 8 h, 24 h, and 48 h. (H) SEM image of a cocultured cell sheet. (I) TEM image of a cocultured cell sheet. (J) Angiogenic factor secretion of the SMC, EPC and coculture groups was measured by ELISA (n = 9). Results are expressed as means ± SD. **p < 0.01; n.s.: not significant. The scale bars show 200 μm in (A, D, E), 50 μm in (C), 100 μm in (G), 10 μm in (H), and 500 nm in (I).

