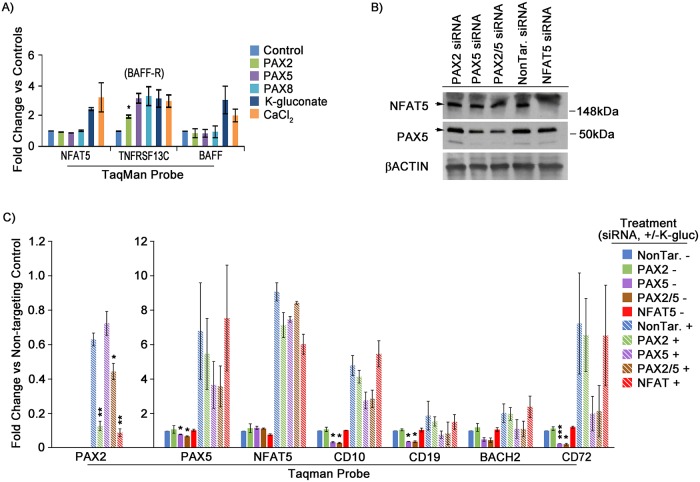
Fig 8. NFAT5 plays a role in hypertonicity mediated PAX2 expression.
A) qRT-PCR validation of RNA-seq data for NFAT5, BAFF-R, and BAFF. Graphs represent the average of two separate experimental replicates. Fold change values are 2-ΔΔCT, relative to each samples’ respective control (i.e., empty vector or untreated), with ACTB used as endogenous reference gene. B) Representative western blot of PAX5 and NFAT5 protein knockdown by siRNA. C) Fold expression of PAX2 (left scale), PAX5, NFAT5, and downstream genes (right scale) after treatment with (+/-) 80mM K-gluconate and (+/-) siRNA knockdown of PAX2, PAX5, PAX2/5, or NFAT5, for 3 experimental replicates. PAX2 values are 2-ΔΔCT, relative to vehicle-treated PAX5 levels. All other gene expression values are 2-ΔΔCT, relative to corresponding vehicle expression values. Protein lysates in part B were bulk harvested from treated cells while RNA in part C was isolated from live cells first flow sorted by FSC-A/SSC-A. Error bars = standard deviation. Statistical significance derived using one sample t-test vs. control treated, assuming unequal variance (i.e., vehicle = 1), p-values * <0.05, ** <0.005, *** <0.0005. See also S9 Fig for TonE elements at PAX2 and PAX5 loci, as well as S8 Fig for NFAT5 target solute channels in response to NFAT5 siRNA knockdown.

