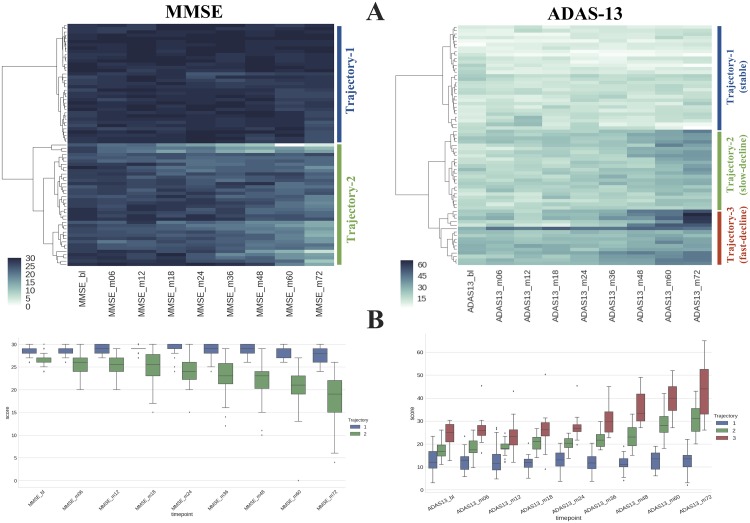
Fig 2. Trajectory modeling.
A) 69 MCI subjects (rows) with six years of clinical scores (columns) were used as input to hierarchical clustering. The color indicates the clinical score at a given timepoint. Euclidean distance between score vectors was used as a similarity metric between two subjects. Ward’s method was used as a linkage criterion. B) Clinical score distribution at each timepoint of different trajectories (stable vs. decliners) derived from hierarchical clustering. Mean scores at each timepoints are used to build a template for each trajectory class.

