
Fig. 2. The invariant TFAP signatures for inhibitors of mitochondria function and proteasomal degradation.
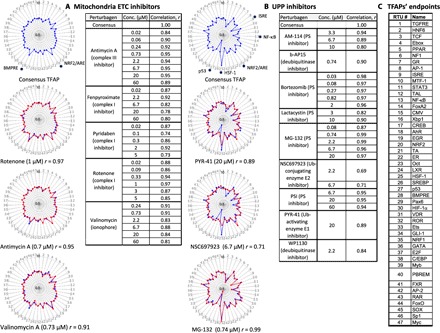
Assay cells (HepG2) were incubated for 24 hours with inhibitors of the mETC or the UPP. Each TFAP signature represents the average data of three independent FACTORIAL assays. The consensus TFAPs of mETC and UPP inhibitors were calculated by clustering the TFAPs of individual perturbagens, as described in Materials and Methods. (A) Representative TFAP signatures of mETC inhibitors. (B) Representative TFAP signatures of UPP inhibitors. Tables A and B show the similarity values r for the TFAPs of the individual perturbagens versus the consensus TFAPs, calculated as a Pearson correlation coefficient. The radial graphs show TFAPs of perturbagens overlaying the consensus TFAPs. Note that the values of TF changes are plotted in a log scale. (C) TFAP endpoints.