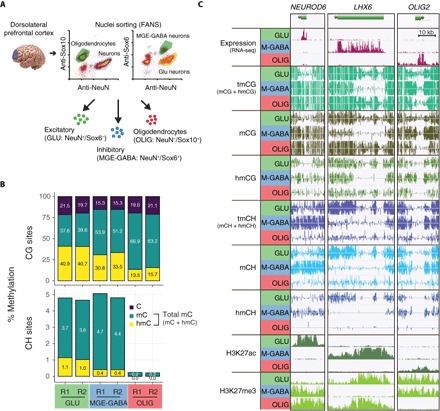
Fig. 1. Unique distributions of hmC and mCH in Glu, MGE-GABA, and OLIG cells from the human PFC.

(A) Method for cell type–specific nuclei isolation for transcriptomic and epigenomic analyses. (B) Genome-wide analysis of mC (OxBS) and hmC (BS-OxBS) shows substantial but significantly different levels of hmCG in both neuronal subtypes (Glu and MGE-GABA) and OLIG. Neurons are enriched in mCH, with a small proportion of hmCH. R1 and R2, biological replicates. (C) Examples of marker genes expressed in Glu (NEUROD6), MGE-GABA (LHX6), or OLIG (OLIG2) cells, together with their DNA methylation and histone modification profiles. Glu (GLU), glutamatergic neurons; MGE-GABA (M-GABA), MGE-derived GABAergic interneurons.
