
Fig. 3. Increased hmCG at MGE-GABA–specific distal gene regulatory elements.
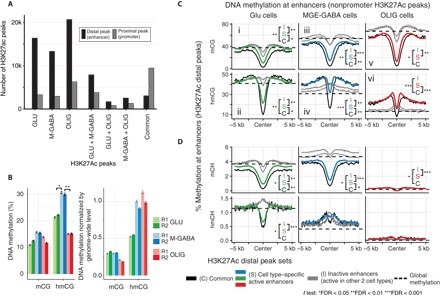
(A) H3K27ac ChIP-seq data identify ~15,000 to 25,000 cell type–specific distal peaks in Glu, MGE-GABA, and OLIG cells. (B) DNA methylation at the center of cell type–specific enhancers. MGE-GABA cells are enriched for hmCG at cell type–specific peaks. R1 and R2, biological replicates. Error bars denote SEM. Significant differences of methylation levels are indicated with asterisks (pairwise t test). (C and D) Mean profile of DNA methylation marks at cell type–specific distal H3K27ac peaks. Genome-wide methylation levels (as in Fig. 1B) are shown in horizontal dashed lines. Differences of methylation levels in the center of the regions were tested between common peaks (C), cell type–specific peaks (S), and inactive peaks (I), and significances are indicated with asterisks (pairwise t test).