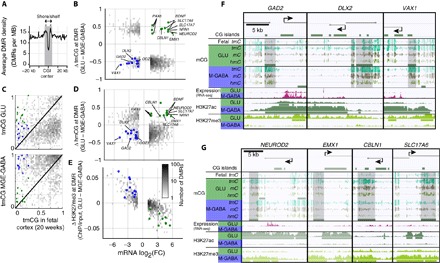
Fig. 5. CGI-associated regions of elevated tmCG near promoters of key neuron subtype–specific genes are enriched in hmCG and depleted of H3K27me3.

(A) Glu versus MGE-GABA tmCG DMR density around CpG islands. CpG shores and shelves (<4 kb away from CpG islands) are indicated in the shaded area. The enrichment of DMRs was tested using DMR density in the flanking region (>10 kb away) as a background control. Asterisks indicate significant enrichments (P < 0.05). (B) Cell type–specific tmCG DMRs within CGIs, shores, and shelves (CGI ± 4 kb) (gray dots). Most tmCG DMRs are negatively related to expression of the nearest gene. A subset of genes has tmCG DMRs with positive association with gene expression (green, Glu-enriched genes; blue, MGE-GABA–enriched genes). (C) tmCG DMRs that demonstrate positive association with gene expression have low tmCG levels in the fetal cortex. These tmCG DMRs demonstrate neuron subtype–specific enrichment in hmCG (D) and H3K27me3 depletion in the gene body of the nearest gene (E). (F and G) Examples of DMRs positively associated with gene expression of nearest MGE-GABA–specific (F) (GAD2, DLX2, and VAX1) or Glu-specific (G) (NEUROD2, EMX1, CBLN1, and SLC17A6) genes. MB, million base pairs or megabase.
