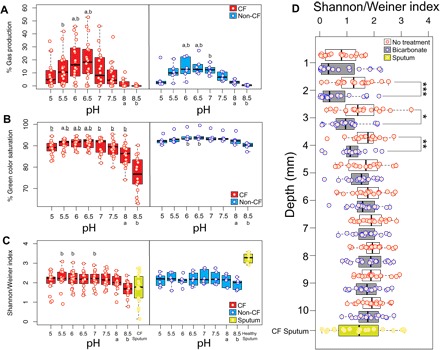
Fig. 1. WinCF microbial physiology and diversity changes in response to pH and oxygen gradients.

Boxplots of the amount of gas produced (A), change in green color saturation (B), and Shannon-Weiner diversity index (C) in the WinCF capillary columns through the pH gradient in both CF and non-CF sputum samples. Letters above the boxplot denote significant differences between the 8 and 8.5 pH samples. (D) Boxplot of the Shannon-Weiner index at each millimeter depth through the WinCF capillary columns with and without bicarbonate treatment. Sputum samples are shown as a reference when applicable. ***P < 0.001, **P < 0.01, *P < 0.05 from Mann-Whitney U test.
